Quick Answer
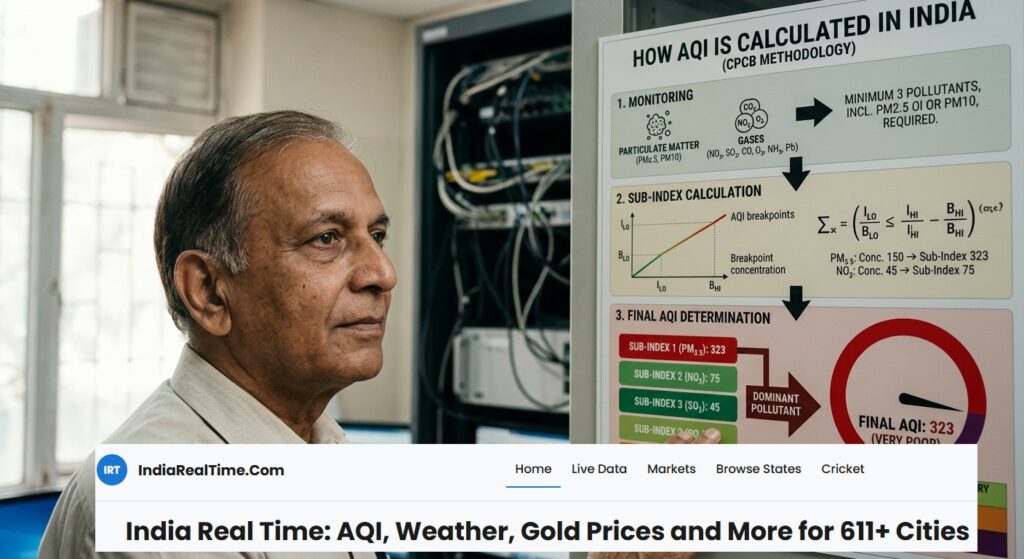
India’s Air Quality Index (AQI) is calculated using the methodology developed by the Central Pollution Control Board (CPCB) under the National Air Quality Index programme. The AQI converts concentrations of multiple air pollutants into a single number between 0 and 500, making it easier for people to understand air quality and associated health risks.
The calculation involves:
- Measuring pollutant concentrations.
- Converting each pollutant into a sub-index.
- Selecting the highest sub-index as the overall AQI.
- Assigning an AQI category and health advisory.
According to the CPCB methodology, the pollutant with the highest sub-index determines the final AQI because it represents the greatest health risk at that time.
What Is AQI?
The Air Quality Index (AQI) is a standardized system that translates complex air pollution measurements into a simple numerical scale.
Instead of reading concentrations for multiple pollutants separately, the AQI provides one value that indicates how clean or polluted the air is and what health effects people may experience.
AQI helps:
- Citizens plan outdoor activities
- Schools monitor air quality
- Government agencies issue health advisories
- Researchers compare pollution levels
- Travelers understand local air conditions
According to CPCB, Which Pollutants Are Used?
The Central Pollution Control Board (CPCB) considers up to eight major pollutants while calculating India’s AQI.
| Pollutant | Chemical Symbol | Common Sources |
|---|---|---|
| Particulate Matter | PM10 | Road dust, construction, industries |
| Fine Particulate Matter | PM2.5 | Vehicle emissions, combustion |
| Nitrogen Dioxide | NO₂ | Traffic, power plants |
| Sulphur Dioxide | SO₂ | Industries, coal burning |
| Carbon Monoxide | CO | Vehicles, incomplete combustion |
| Ozone | O₃ | Chemical reactions in sunlight |
| Ammonia | NH₃ | Agriculture, fertilizers |
| Lead | Pb | Industrial emissions |
Not every monitoring station measures all eight pollutants, but AQI requires sufficient valid pollutant data before it can be calculated.
How AQI Is Calculated: Step-by-Step
The CPCB methodology follows a structured process.
Step 1: Measure Pollutant Concentrations
Air quality monitoring stations continuously measure pollutant concentrations.
Examples:
- PM2.5 (µg/m³)
- PM10 (µg/m³)
- NO₂ (µg/m³)
- CO (mg/m³)
These measurements are collected over specified averaging periods depending on the pollutant.
Step 2: Calculate Individual Sub-Indices
Each pollutant concentration is converted into an AQI sub-index.
The conversion uses predefined breakpoint tables developed by the CPCB.
For example:
| PM2.5 Concentration | AQI Sub-Index |
|---|---|
| 0–30 | 0–50 |
| 31–60 | 51–100 |
| 61–90 | 101–200 |
| 91–120 | 201–300 |
| 121–250 | 301–400 |
| Above 250 | 401–500 |
Values that fall between breakpoints are calculated using linear interpolation.
Step 3: Select the Highest Sub-Index
This is the most important part of India’s AQI system.
Suppose a monitoring station reports:
| Pollutant | Sub-Index |
|---|---|
| PM2.5 | 182 |
| PM10 | 121 |
| NO₂ | 64 |
| CO | 43 |
The final AQI is:
AQI = 182
The pollutant with the highest sub-index becomes the dominant pollutant because it poses the greatest health concern.
Step 4: Assign AQI Category
The AQI value is then assigned to one of six categories.
| AQI | Category | Health Impact |
|---|---|---|
| 0–50 | Good | Minimal impact |
| 51–100 | Satisfactory | Minor discomfort for sensitive individuals |
| 101–200 | Moderate | Breathing discomfort for sensitive groups |
| 201–300 | Poor | Discomfort during prolonged exposure |
| 301–400 | Very Poor | Respiratory illness risk increases |
| 401–500 | Severe | Serious health effects for everyone |
AQI Formula Used by CPCB
Each pollutant’s sub-index is calculated using linear interpolation between concentration breakpoints.
The general formula is:I=(BHI−BLO)(IHI−ILO)(C−BLO)+ILO
Where:
| Symbol | Meaning |
|---|---|
| I | AQI sub-index |
| C | Measured pollutant concentration |
| BHI | Upper concentration breakpoint |
| BLO | Lower concentration breakpoint |
| IHI | AQI corresponding to upper breakpoint |
| ILO | AQI corresponding to lower breakpoint |
This ensures smooth transitions between AQI ranges rather than abrupt jumps.
Why PM2.5 Often Determines India’s AQI
In many Indian cities, PM2.5 is frequently the dominant pollutant because:
- Vehicle emissions
- Biomass burning
- Industrial emissions
- Construction dust
- Secondary particle formation
Fine particles can penetrate deep into the lungs and even enter the bloodstream, making them particularly important from a public health perspective.
Minimum Data Requirements
The CPCB methodology requires enough valid monitoring data before an AQI can be published.
Generally:
- Multiple pollutants should have valid measurements.
- At least one particulate pollutant (PM2.5 or PM10) should be available.
- Data quality checks are performed before AQI publication.
This helps ensure the reported AQI accurately reflects ambient air quality.
Why AQI Changes Throughout the Day
AQI is dynamic and can change because of:
- Traffic volume
- Industrial emissions
- Wind speed
- Rainfall
- Temperature inversions
- Seasonal crop residue burning
- Fireworks during festivals
Weather conditions often influence how pollutants disperse or accumulate.
Why Two Cities Can Have Different AQIs
Even neighbouring cities may record different AQI values due to:
- Local traffic
- Industrial activity
- Construction
- Geography
- Wind direction
- Weather patterns
This is why city-specific AQI reporting is important.
How IndiaRealTime Helps Users Monitor AQI
Understanding AQI methodology is valuable, but people also need quick access to current conditions.
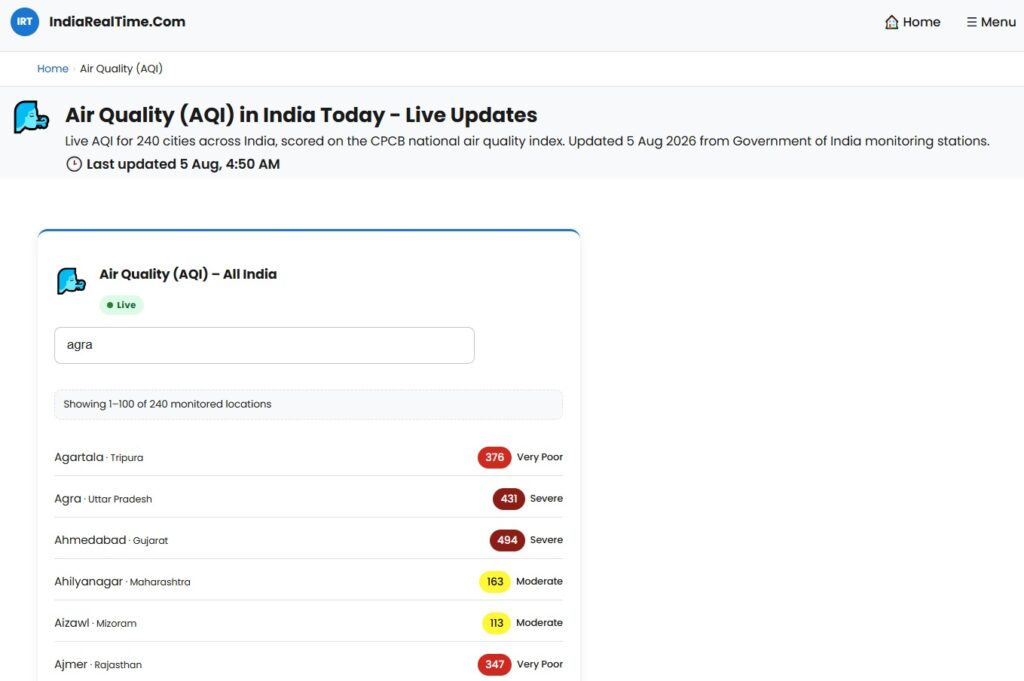
IndiaRealTime provides city-wise AQI information in an easy-to-read format, helping users:
- Check today’s AQI before leaving home.
- Monitor pollution trends.
- Compare air quality across cities.
- Plan outdoor activities.
- Stay informed during high-pollution periods.
By combining AQI with weather updates and other essential information, users can make more informed daily decisions without visiting multiple websites.
Ref/ Air Quality (AQI) in India Today – Live Updates
Frequently Asked Questions
Who calculates AQI in India?
The Central Pollution Control Board (CPCB) developed India’s National Air Quality Index methodology, while pollution monitoring data is collected through CPCB and State Pollution Control Boards.
What is the maximum AQI value in India?
The AQI scale ranges from 0 to 500.
Which pollutant usually controls AQI?
In many Indian cities, PM2.5 is often the dominant pollutant because it frequently has the highest sub-index.
Does rainfall reduce AQI?
Rain can temporarily improve air quality by removing particulate matter from the atmosphere, although the effect depends on rainfall intensity and local conditions.
Is an AQI of 150 dangerous?
An AQI of 150 falls in the Moderate category. Sensitive groups, such as children, older adults, and people with respiratory conditions, may experience breathing discomfort and should consider limiting prolonged outdoor exertion.
Key Takeaways
- India’s AQI is based on the methodology developed by the Central Pollution Control Board (CPCB).
- AQI converts pollutant concentrations into a simple 0–500 scale.
- The pollutant with the highest sub-index becomes the reported AQI.
- Eight major pollutants may be considered in the calculation, depending on available monitoring data.
- AQI categories help people understand potential health impacts and take appropriate precautions.
- Checking city-specific AQI regularly can help individuals make informed decisions about outdoor activities.
Conclusion
India’s Air Quality Index is designed to transform complex environmental measurements into information that anyone can understand. By using a standardized methodology developed by the CPCB, AQI provides a consistent way to compare air quality across cities and over time. Check now Bengaluru AQI, Mumbai Air Quality and Delhi AQI.
Understanding how AQI is calculated—from pollutant measurement to sub-index calculation and final category assignment—helps citizens interpret air quality reports more confidently. Combined with regular monitoring through platforms like IndiaRealTime, AQI becomes a practical tool for planning daily activities, protecting health, and staying informed about changing environmental conditions.

Want more like this?
Explore Air Quality & AQI →