Delhi AQI Winter 2026-27 Starts Cleaner Than the Last 3 Winters
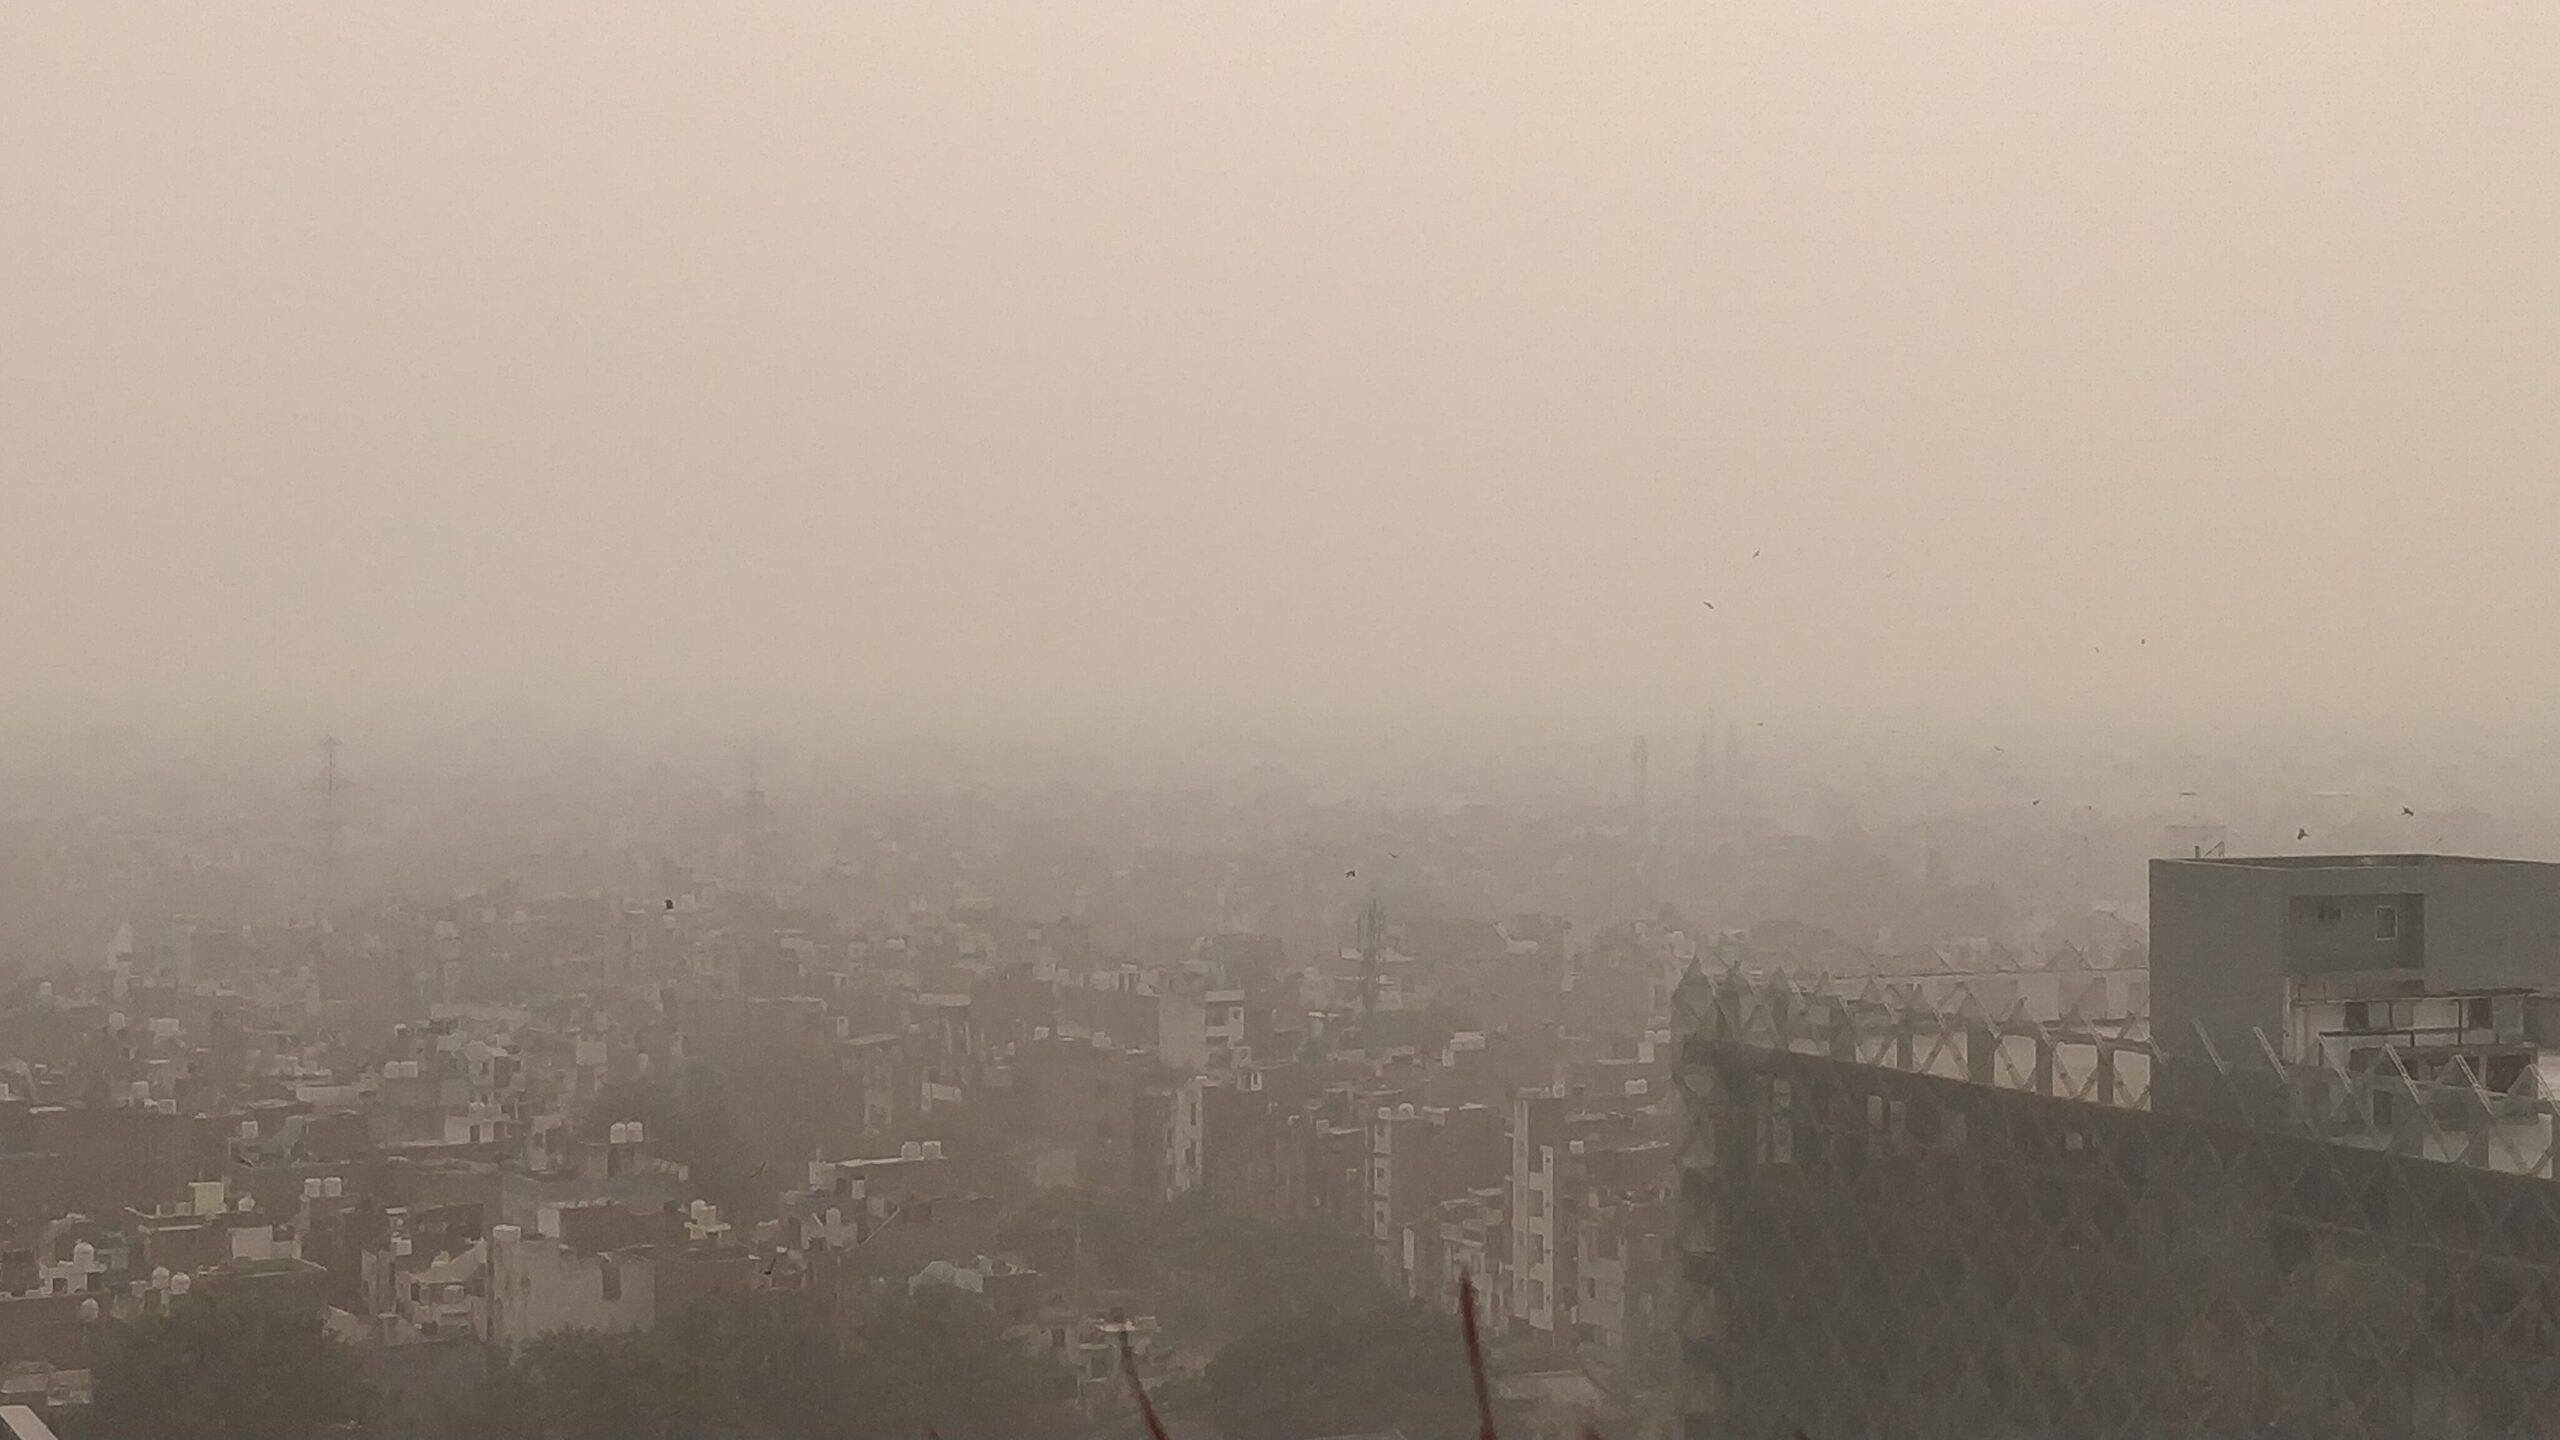

Delhi’s average AQI over the first 17 days of October 2026 was 152, the lowest for that stretch in any of the last four years, and the city has not had a single “Poor” day yet. By the same date in 2023, 2024 and 2025 it had logged 7, 4 and 4 Poor days. That is based on all 68 of CPCB’s official daily bulletins for 1 to 17 October in each year. The caveat matters as much as the number: winter has barely started, and Delhi’s worst air has always arrived in November.
1 to 17 October: 2026 against the last three years
| 2023 | 2024 | 2025 | 2026 | |
|---|---|---|---|---|
| Average AQI, 1 to 17 Oct | 188 | 177 | 157 | 152 |
| Average, 1 to 6 Oct | 169 | 160 | 124 | 177 |
| Average, 7 to 17 Oct | 199 | 187 | 175 | 139 |
| Poor days (AQI above 200) | 7 | 4 | 4 | 0 |
| Satisfactory days (100 or below) | 1 | 0 | 4 | 2 |
| Worst day | 257 (14 Oct) | 285 (17 Oct) | 254 (17 Oct) | 187 (4 Oct) |
| First Poor day | 6 Oct | 13 Oct | 14 Oct | Not yet |
The shape of the month is the real story. In each of the last three years, Delhi’s air got worse as October went on: the average rose from 169 to 199 between the first six days and the next eleven in 2023, from 160 to 187 in 2024, and from 124 to 175 in 2025. This year it went the other way, from 177 to 139. October 2026 actually started worse than any of the three earlier years, which is why early reports called it the most polluted start to October in four years. Then it cleaned up, including a Satisfactory reading of 83 on 12 October.
That also means GRAP Stage I, the first tier of Delhi-NCR’s emergency pollution plan, which is meant for AQI between 201 and 300, has had no day in that range to respond to on the CPCB 4 PM bulletin. In 2024 and 2025 Stage I came in around 14 to 15 October, right after the first Poor days in our table.
Day by day
| Date | 2023 | 2024 | 2025 | 2026 |
|---|---|---|---|---|
| 1 Oct | 147 | 151 | 130 | 166 |
| 2 Oct | 146 | 174 | 123 | 174 |
| 3 Oct | 155 | 162 | 88 | 171 |
| 4 Oct | 176 | 183 | 138 | 187 |
| 5 Oct | 177 | 145 | 159 | 184 |
| 6 Oct | 212 | 143 | 105 | 179 |
| 7 Oct | 216 | 126 | 73 | 136 |
| 8 Oct | 164 | 167 | 81 | 162 |
| 9 Oct | 175 | 164 | 100 | 176 |
| 10 Oct | 180 | 132 | 170 | 122 |
| 11 Oct | 193 | 141 | 199 | 111 |
| 12 Oct | 220 | 155 | 167 | 83 |
| 13 Oct | 256 | 224 | 189 | 158 |
| 14 Oct | 257 | 234 | 211 | 181 |
| 15 Oct | 233 | 198 | 233 | 149 |
| 16 Oct | 207 | 230 | 245 | 90 |
| 17 Oct | 89 | 285 | 254 | 159 |
What the last three winters looked like
The early October numbers only mean something next to what came after them. Here is each of the last three winters, October to February, from the same bulletins:
| Winter | Oct | Nov | Dec | Jan | Feb | Winter average | Days above 300 | Severe days (above 400) | Worst day |
|---|---|---|---|---|---|---|---|---|---|
| 2023-24 | 219 | 372 | 348 | 355 | 218 | 303 | 91 | 15 | 468 on 3 Nov 2023 |
| 2024-25 | 234 | 374 | 294 | 305 | 214 | 285 | 68 | 14 | 494 on 18 Nov 2024 |
| 2025-26 | 223 | 354 | 351 | 308 | 233 | 295 | 80 | 10 | 461 on 14 Dec 2025 |
- November is the worst month every year, averaging between 354 and 374, deep in the Very Poor band. December and January stay close behind.
- 2024-25 was the mildest of the three overall at 285, but it also had the single worst day, 494 on 18 Nov 2024.
- 2025-26 had the fewest Severe days (10) but more Very Poor days than 2024-25, so it averaged 295, worse than the year before.
- In every one of the three winters, the second half of October averaged far above the first 17 days: 256, 303, 304 for 18 to 31 October.
What this October does and does not tell you
A clean start has not predicted a clean winter. 2025 had the cleanest early October of the three earlier years, at 157, and still produced a winter average of 295 with 80 days above 300. Stubble burning in Punjab and Haryana peaks in late October and early November, and the cold, still air that traps pollution near the ground sets in at the same time.
Diwali timing also shifts the comparison. Diwali fell on 20 October last year, and Delhi’s AQI that day was 345. This year it falls on 8 November, so the firecracker spike will land in what is already the worst month. The September figures were good too: Delhi recorded its lowest September average in five years, but September has never been the problem.
The honest reading of the first 17 days is that Delhi has gained a few weeks of breathing room, not that this winter will be milder. The comparison that matters will come at the end of November.
For the live reading, IndiaRealTime’s Delhi page shows current AQI next to weather and fuel prices, and the air quality tracker covers cities across India. The Cost of Living and Breathing Index compares 273 cities on live air quality and fuel prices, and IMD weather alerts flag the fog and calm-wind days that usually come with the worst smog. If you want to know what the AQI number itself measures, our guide to how CPCB calculates AQI explains the sub-indices behind it. Elsewhere on IndiaRealTime, our list of India’s 28 states and 8 union territories explains where Delhi fits as a union territory with its own legislature.
FAQs
What is Delhi’s AQI this winter so far? The average for 1 to 17 October 2026 was 152, in the Moderate band, with no Poor day yet.
Is Delhi’s air better this October than last year? Yes for the first 17 days: 152 against 157 in 2025, 177 in 2024 and 188 in 2023. It started worse than all three in the first week, then improved.
Which month has the worst AQI in Delhi? November. It averaged 372, 374, 354 in 2023, 2024 and 2025.
How many Severe AQI days did Delhi have last winter? 10 days above 400 between October 2025 and February 2026, against 14 the winter before and 15 in 2023-24.
When is Diwali in 2026? 8 November, nearly three weeks later than in 2025.
Sources
- CPCB: Daily AQI Bulletin (example, 17 October 2026). All 469 bulletins used follow the same URL pattern by date.
- Tribune India: November AQI averages for 2023, 2024 and 2025, citing CPCB
- India.com: Most polluted start to October in four years
- Business Standard: Lowest September AQI in five years; CAQM winter measures
- All India Radio: GRAP Stage I invoked, October 2024
- All India Radio: GRAP Stage I invoked, October 2025
Updated 18 October 2026 with CPCB bulletins up to 17 October. Our monthly averages are computed from the daily 4 PM bulletins and can differ by a few points from monthly figures CPCB publishes separately; for November 2024 they match exactly at 374.

Want more like this?
Explore Air Quality & AQI →