1 USD to INR in 1947 Was Rs 3.31, Not Rs 1. Every Year Till 2035
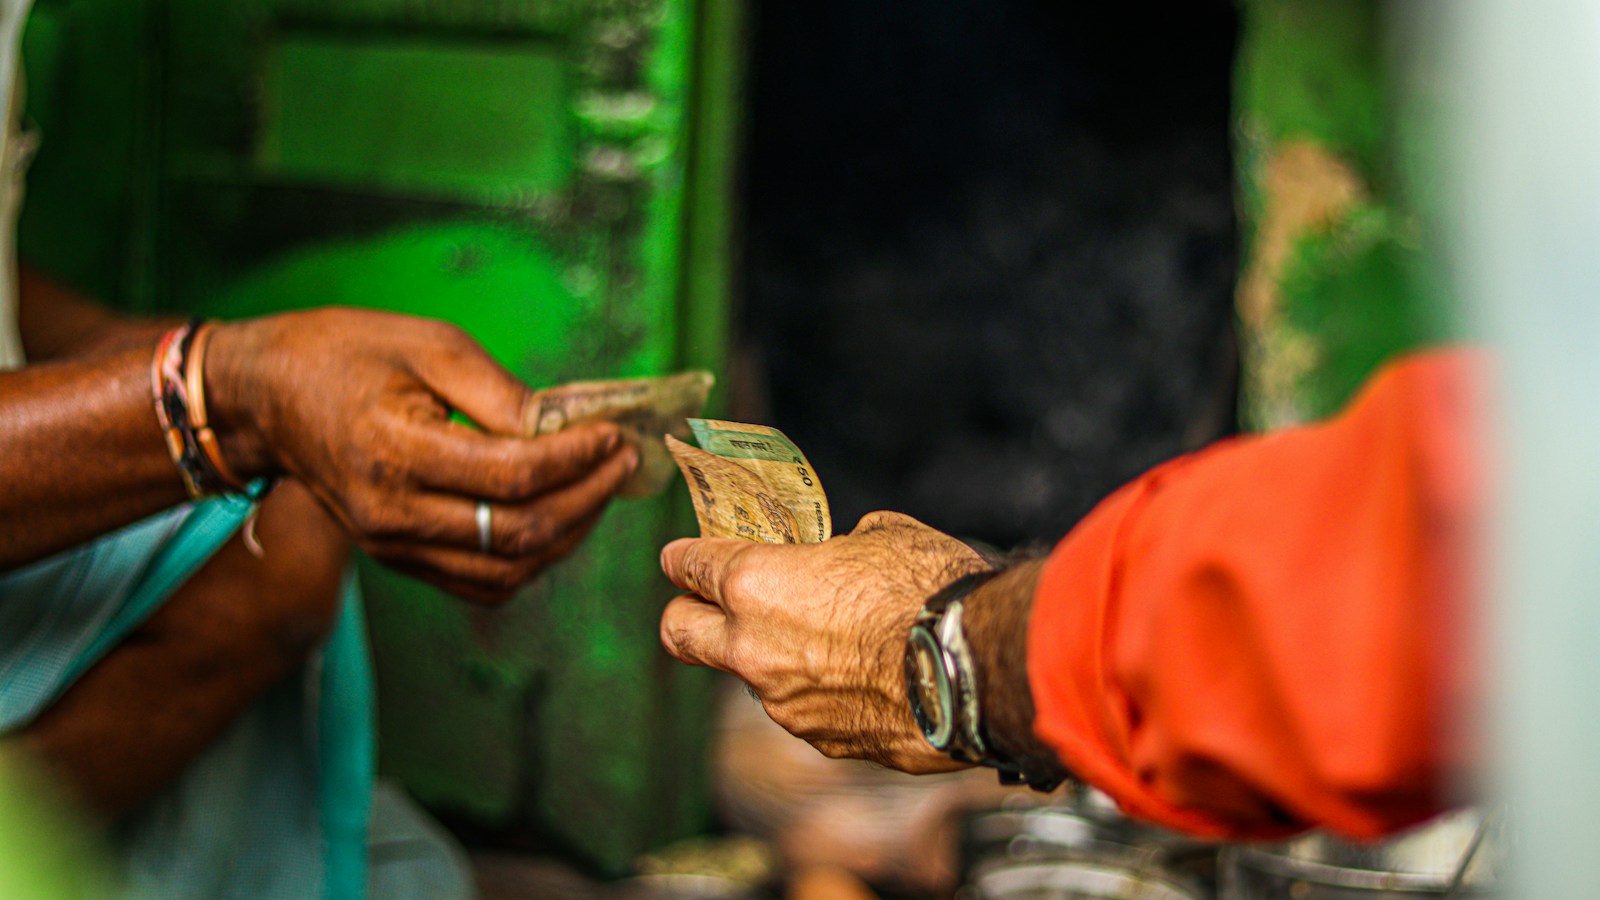
In 1947, one US dollar cost Rs 3.31, not Rs 1 as a widely shared claim says. On 2 October 2026 the same dollar costs Rs 96.32, about 29 times as much. Put the other way, a rupee today buys roughly 3.4% of the dollars it bought at Independence. Below is the rate for every year from 1947 to 2026, the handful of decisions that caused most of the fall, and what the rupee’s own history says about where it could be by 2035.
Why 1 USD was never equal to Rs 1
At Independence the rupee was not tied to the dollar at all. It was tied to the British pound at 1 shilling 6 pence, which works out to Rs 13.33 per pound. The pound was then fixed at $4.03, so a dollar cost 13.33 divided by 4.03, or Rs 3.31. The “1 dollar equals 1 rupee in 1947” line that circulates every Independence Day has no basis in any official rate. The INR to GBP rate today tells you how far that old anchor has drifted too.
The four decisions that moved the rupee most
For most of its first 45 years the rupee did not float. Its value was set by policy, so it moved in sudden steps rather than daily drifts.
1949: Britain devalued the pound from $4.03 to $2.80 on 18 September. India kept the rupee at Rs 13.33 per pound, so the dollar rate jumped from Rs 3.31 to Rs 4.76 overnight without India changing anything on its side. That Rs 4.76 rate then held for almost 17 years.
1966: After two wars and a severe drought, and under pressure from the World Bank and the US to qualify for aid, the government devalued the rupee to Rs 7.50 on 6 June 1966. That is a 57% rise in the price of a dollar in a single day. Measured by yearly averages, 1966 is still the rupee’s worst year on record.
1971 to 1975: The Bretton Woods system of fixed exchange rates collapsed in 1971. India stayed with sterling for a while, then on 25 September 1975 cut the link and pegged the rupee to an undisclosed basket of its major trading partners’ currencies. From here the rupee slid slowly rather than in big jumps, from about Rs 8 in the mid-1970s to Rs 17.50 by 1990.
1991 to 1993: With foreign reserves down to a few weeks of imports, the RBI devalued the rupee in two steps on 1 and 3 July 1991, about 18% in all. In March 1992 India moved to a dual rate (the Liberalised Exchange Rate Management System), and in March 1993 it unified the rates and let the market set them. Since 1993 the rupee has been a managed float: the market sets the price and the RBI steps in to slow sharp moves.
1 USD to INR every year from 1947 to 2026
| Year | Rs per 1 USD | What happened |
|---|---|---|
| 1947 | 3.31 | Rupee tied to sterling at Rs 13.33 per pound |
| 1948 | 3.31 | |
| 1949 | 3.31 / 4.76 | Sterling devalued on 18 September; Rs 3.31 before, Rs 4.76 after |
| 1950 | 4.76 | Fixed at Rs 4.76 until June 1966 |
| 1951 | 4.76 | |
| 1952 | 4.76 | |
| 1953 | 4.76 | |
| 1954 | 4.76 | |
| 1955 | 4.76 | |
| 1956 | 4.76 | |
| 1957 | 4.76 | |
| 1958 | 4.76 | |
| 1959 | 4.76 | |
| 1960 | 4.76 | |
| 1961 | 4.76 | |
| 1962 | 4.76 | |
| 1963 | 4.76 | |
| 1964 | 4.76 | |
| 1965 | 4.76 | |
| 1966 | 6.36 | Devalued to Rs 7.50 on 6 June; figure is the yearly average |
| 1967 | 7.50 | |
| 1968 | 7.50 | |
| 1969 | 7.50 | |
| 1970 | 7.50 | |
| 1971 | 7.49 | Bretton Woods system collapses |
| 1972 | 7.59 | |
| 1973 | 7.74 | |
| 1974 | 8.10 | |
| 1975 | 8.38 | Sterling link dropped for a currency basket on 25 September |
| 1976 | 8.96 | |
| 1977 | 8.74 | |
| 1978 | 8.19 | |
| 1979 | 8.13 | |
| 1980 | 7.86 | |
| 1981 | 8.66 | |
| 1982 | 9.46 | |
| 1983 | 10.10 | |
| 1984 | 11.36 | |
| 1985 | 12.37 | |
| 1986 | 12.61 | |
| 1987 | 12.96 | |
| 1988 | 13.92 | |
| 1989 | 16.23 | |
| 1990 | 17.50 | |
| 1991 | 22.74 | Devalued about 18% in two steps, 1 and 3 July |
| 1992 | 25.92 | Dual rate (LERMS); market rate averaged 28.16 |
| 1993 | 30.49 | Rates unified in March, market rate averaged 31.29 |
| 1994 | 31.37 | |
| 1995 | 32.43 | |
| 1996 | 35.43 | |
| 1997 | 36.31 | |
| 1998 | 41.26 | |
| 1999 | 43.06 | |
| 2000 | 44.94 | |
| 2001 | 47.19 | |
| 2002 | 48.61 | |
| 2003 | 46.58 | |
| 2004 | 45.32 | |
| 2005 | 44.10 | |
| 2006 | 45.31 | |
| 2007 | 41.35 | Rupee’s best year: gained 8.7% |
| 2008 | 43.51 | |
| 2009 | 48.41 | |
| 2010 | 45.73 | |
| 2011 | 46.67 | |
| 2012 | 53.44 | |
| 2013 | 58.60 | Taper tantrum year |
| 2014 | 61.03 | |
| 2015 | 64.15 | |
| 2016 | 67.20 | |
| 2017 | 65.12 | |
| 2018 | 68.39 | |
| 2019 | 70.42 | |
| 2020 | 74.10 | |
| 2021 | 73.92 | |
| 2022 | 78.60 | |
| 2023 | 82.60 | |
| 2024 | 83.67 | |
| 2025 | 87.16 | |
| 2026 | 93.96 | Average from 1 January to 2 October; 96.32 on 2 October |
One caution on 1992 and 1993. During the dual-rate period, the World Bank series records the official rate (25.92 and 30.49) while the US Federal Reserve’s series records the market rate (28.16 and 31.29). Both are correct for what they measure. For every other year from 1973 onward the two sources agree within about 1%.
What 79 years of data actually show
The rupee has risen against the dollar in only 12 of the 65 years from 1961 to 2025, and the best of those was 2007, when it gained 8.7%. The biggest yearly falls were 1966 (33.5%, the devaluation), 1991 (29.9%), 1967 (17.9%), 1993 (17.7%, the move to a market rate), 1989 (16.6%) and 2012 (14.5%).
Since the rate was freed, the slide has been remarkably steady. From 1994 to 2025 the rupee lost about 3.35% a year on average. Over the last 20 years it was 3.47% a year, and over the last 10 years 3.11%. That steadiness mostly reflects inflation: Indian prices have usually risen faster than American prices, and a currency tends to lose value against another at roughly the gap between their inflation rates.
2026 breaks the pattern. The year-to-date average of 93.96 is 7.8% weaker than the 2025 average of 87.16, the steepest yearly fall since 2013. Crude above $100 a barrel has been the main pressure, with US tariff threats adding to it. Both are covered below.
USD to INR prediction till 2035
Nobody can forecast a currency nine years out, and anyone giving a single number for 2035 is guessing. What the history above does allow is a range built from the rupee’s own record. The table uses three yearly rates of decline, each starting from the 2 October 2026 rate of 96.32:
- Slow fall, 2.0% a year: the gap between the RBI’s 4% inflation target and the US Federal Reserve’s 2% target. This is roughly what happens if India keeps inflation on target and nothing else goes wrong.
- Recent trend, 3.1% a year: the actual average from 2015 to 2025.
- Long-run pace, 4.8% a year: the actual average from 1973 to 2025, which includes the 1991 crisis.
| Year | Slow fall (2.0% a year) | Recent trend (3.1% a year) | Long-run pace (4.8% a year) |
|---|---|---|---|
| 2027 | 98.2 | 99.3 | 100.9 |
| 2028 | 100.2 | 102.4 | 105.8 |
| 2029 | 102.2 | 105.6 | 110.9 |
| 2030 | 104.3 | 108.8 | 116.2 |
| 2031 | 106.3 | 112.2 | 121.8 |
| 2032 | 108.5 | 115.7 | 127.6 |
| 2033 | 110.6 | 119.3 | 133.7 |
| 2034 | 112.9 | 123.0 | 140.2 |
| 2035 | 115.1 | 126.8 | 146.9 |
On these numbers, the dollar crosses Rs 100 sometime in 2027 or 2028 in every scenario. By 2030 the range is about Rs 104 to Rs 116, and by 2035 about Rs 115 to Rs 147. The middle path puts 2035 near Rs 127. Real years will not be this smooth. 2026 alone ran at more than twice the trend, and the rupee also had years like 2007 when it strengthened. Oil prices, US interest rates and how hard the RBI leans against sharp moves will decide which line it actually tracks.
What this means for your money
For anyone paying in dollars, whether foreign tuition, travel or imported goods, the history argues for budgeting a 3% to 5% yearly rise in rupee cost on top of the price itself. For Indians abroad sending money home, the same trend works in their favour. For savers, a fixed deposit’s return in dollar terms is roughly its interest rate minus the rupee’s yearly fall, so a 7% deposit is worth about 4% a year to someone measuring in dollars. Current rates are on the FD rates page. Gold, which is priced globally in dollars, has tended to rise in rupee terms partly because of this slide, which you can track on the gold price page.
The live rate is on IndiaRealTime’s INR to USD tracker. For why the rupee broke 95 this September, see our explainer on the move. The oil side of the story is in why petrol prices have not moved despite $100 crude, and the trade side is in the US move toward 100% tariffs on India.
FAQs
What was 1 USD to INR in 1947? Rs 3.31. The rupee was fixed to the pound at Rs 13.33, and the pound was fixed at $4.03.
Was the rupee ever equal to the dollar? No. No official rate since Independence has put the rupee at par with the dollar. The lowest the dollar has cost is Rs 3.31, from 1947 to September 1949.
When did the rupee fall the most? In 1966, when it was devalued from Rs 4.76 to Rs 7.50 on 6 June. The 1991 devaluation in July is second.
What is 1 USD to INR today? Rs 96.32 on 2 October 2026, per the Frankfurter reference rate. The 2026 average so far is Rs 93.96.
Will the dollar reach Rs 100? On all three scenarios above, yes, by 2027 or 2028. Only the fastest-decline scenario gets there within 2027.
What will 1 USD to INR be in 2030? About Rs 104 to Rs 116 based on the rupee’s own past rates of decline, with Rs 109 as the middle case. Treat this as a range, not a prediction.
Sources
- World Bank: Official exchange rate, India (LCU per US$, period average), 1960 to 2025
- FRED, Federal Reserve Bank of St. Louis: India / U.S. Foreign Exchange Rate (AEXINUS), 1973 to 2025
- FRED: India / U.S. daily exchange rate (DEXINUS), 2026
- Frankfurter: daily USD to INR reference rates, 2026
- Reserve Bank of India: Brief chronology, 1935 to 1949
- Wikipedia: Exchange rate history of the Indian rupee
- Forbes India: Devaluation of the rupee (1966)
- Business Standard: 25 years of the rupee’s historic devaluation
Updated 2 October 2026. Historical rates are annual averages; the 2026 figure will change until the year closes.

Want more like this?
Explore India Real Time →